

Easy Steps to Connect Fortigate Firewall with Splunk — Part 3


In the previous parts of this series, we introduced the foundational steps to integrate your Apache server with Splunk. In this continuation, we delve into the technical specifics, guiding you through the process of setting up your Fortigate Firewall in a virtual environment and configuring Splunk to receive and process its logs.
Step 1: Download VMware Workstation
Begin by downloading VMware Workstation. This software allows you to run multiple virtual machines on your PC. It’s instrumental for creating a virtual environment for your Fortigate Firewall.
Step 2: Download the Fortigate VMware File
Next, obtain the Fortigate VMware file. This file contains the virtualized version of the Fortigate Firewall, which you’ll run using VMware Workstation.
Step 3: Import Fortigate VM into Workstation
After downloading the Fortigate VMware file, simply double-click on it. This action will trigger VMware Workstation to import the Fortigate virtual machine.
Step 4: Assign Static IP to Firewall
As discussed in Part 1, your Fortigate Firewall needs a static IP address. Assigning a static IP ensures consistent network communication and eases management and configuration tasks.
Step 5: Use Commands to Set IP and Gateway
You can find the necessary commands to set up a static IP and gateway for your firewall in the same repository mentioned earlier. These commands are critical for ensuring that your firewall is correctly configured for network communication.
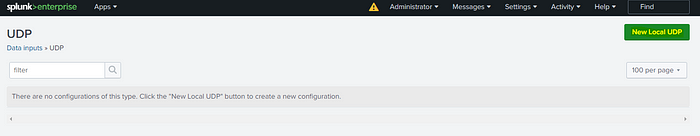
Step 6: Navigate to Splunk Interface
Once your firewall is set with a static IP, switch to the Splunk interface. Go to Settings > Data Inputs > UDP (For syslog) > New Local UDP.
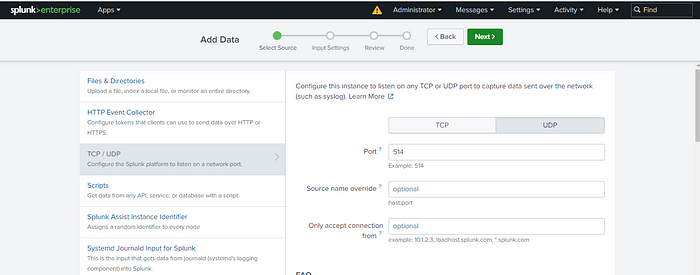
Step 7: Configure Syslog Port
Set the port to 514, which is the default for syslog. After setting the port, click ‘Next’ to proceed.
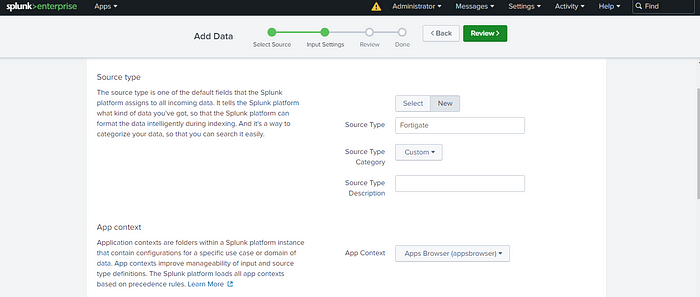
Step 8: Define Sourcetype
For Sourcetype, select ‘New’ and name it (e.g., Fortigate or another name of your choice) for your firewall logs. It’s best to leave the default settings intact and then proceed to create a new index.
Step 9: Create and Name Index
This step involves creating and naming your index, which is crucial for log management. For instance, naming it ‘Firewall’ helps in identifying and sorting your logs. Keep other fields at their default settings.
Step 10: Review Settings
Click ‘Review’ to overview all the settings you’ve configured. This step is vital to ensure everything is set up correctly before finalizing.
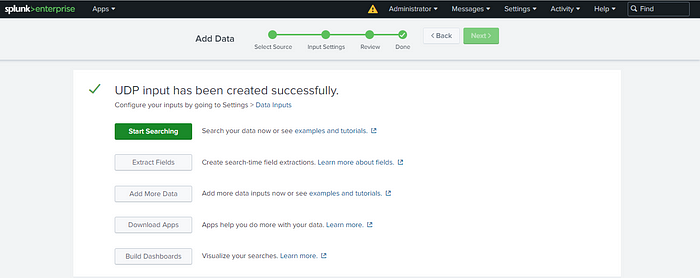
Step 11: Submit Configuration
After reviewing and ensuring all settings are correct, click ‘Submit’ to finalize the configuration.
Step 12: Search and Analyze Logs
With everything set up, you can now use this index in Splunk to search through your firewall logs. This setup allows you to extract fields and perform various analytical operations on your log data.
By following these steps, you’ve successfully integrated your Fortigate Firewall with Splunk using VMware Workstation. This integration will enhance your network monitoring capabilities, allowing for effective log management and analysis. Remember, regular checks and updates are essential to maintain optimal performance and security.
Special Thanks: Before wrapping up, I’d like to extend a heartfelt thank you to Ahmed Elakwah for his exceptional Udemy course on advanced Splunk configurations and management. His insights and teachings have been instrumental in my understanding and expertise in this area. If you’re looking to deepen your knowledge in Splunk, I highly recommend checking out his course.
🔗 Explore Ahmed Elakwah’s Splunk Course on Udemy: Advance Splunk Configurations and Management